TraqNext

Stop guessing who's drowning in work.
TraqNext shows you.

Most teams run blind on workload. Two engineers carry 70% of sprint work while three others are under-utilised — and nobody sees it until a deadline slips. TraqNext surfaces those imbalances in real time, before they become your next incident.
Explore today - full access, no credit card required!
The Problem

Workload imbalance is invisible — until it costs you

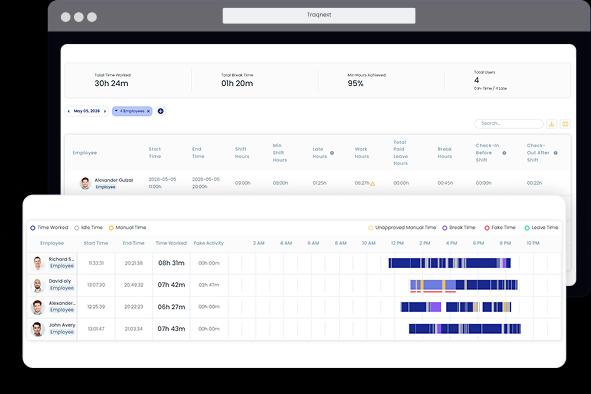
Timesheets and reports what people say they worked on. TraqNext records what actually happened — tracked hours, active time, idle periods, and task-level focus — giving managers a factual picture of how work is distributed across the team, every single day.

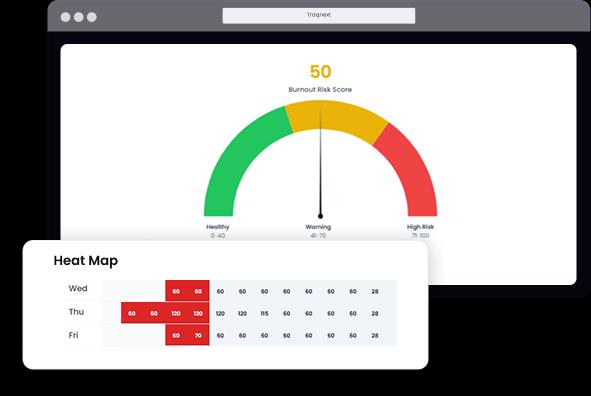
Workload management software goes beyond task assignment. It tracks the actual time each person spends working, detects when anyone's load is pushing into burnout territory, and gives managers the data to rebalance before delivery suffers. TraqNext does all of this automatically, without manual time entry or complex configuration.

image
Comparison

TraqNext vs manual tracking vs project management tools

Every approach to workload management has trade-offs. Here's an honest breakdown of where each one falls short — and where TraqNext fills the gaps.

CapabilityTraqNext RECOMMENDEDManual TrackingSpreadsheets / Stand-upsProject Management ToolsJira, Asana, Monday
Actual hours worked per employee✓ Automatic — tracked continuously from desktop agent⚠ Self-reported — prone to rounding and omission✗ Estimate only — logged manually if at all
Idle time detection✓ Detected automatically via mouse & keyboard inactivity✗ Not captured✗ Not captured
Overload / underload flagging✓ Real-time anomaly alerts when patterns deviate⚠ Manager must notice in reviews — often too late⚠ Task count visible, but actual effort not measured
Burnout prediction✓ Predictive Burnout Analysis from multiple aspects — Context-Switching Fatigue, Digital Exhaustion Score, Focus vs. Fatigue Trend, Work-Life Balance Heatmap✗ No predictive capability✗ No predictive capability
App & website usage per task✓ Logged automatically — shows where time actually goes✗ Not tracked⚠ Integrations only — not native
Attendance without physical sign-in✓ Captured automatically when tracking starts — works for remote & hybrid⚠ Requires manual logging or separate system✗ Not a core feature
Project billing & cost tracking✓ Project-level and employee-level billing rates with payroll auto-calculation⚠ Manual calculation from logged hours⚠ Requires paid add-ons or third-party tools
On-premises deployment✓ Available — with dedicated implementation support for enterprise✓ Data stays local by default⚠ Cloud-first; self-hosted plans vary by vendor
GDPR compliance✓ GDPR-compliant; screenshots can be disabled or blurred by admin⚠ Depends on storage practices⚠ Varies by vendor and region
Setup time✓ Minutes — invite by email, sync starts immediately⚠ Days to design, train, and enforce⚠ Hours to days — workspace config & onboarding
Manager overhead✓ Low — automated alerts replace manual review✗ High — all analysis is manual⚠ Medium — dashboards exist but require interpretation
Real-World Scenario

A 30-person engineering team, two overloaded developers — here's how TraqNext caught it

The sprint looked fine in Jira. It wasn't. Two developers were carrying the team — and nobody knew until the anomaly alert fired.

  • The hidden problemA 30-person engineering team was three weeks into a critical product release. Sprint velocity looked healthy in Jira. Standups ran smoothly. But two senior developers — responsible for the payment gateway integration — had quietly accumulated 56-hour weeks for 12 consecutive days. No ticket reflected this. No manager spotted it.
  • What TraqNext detectedTraqNext's Anomaly Detection flagged both developers on Day 10 — their active tracked hours had exceeded the team average by more than 40% for seven consecutive days. The Predictive Burnout Analysis showed a rising Digital Exhaustion Score and a Work-Life Balance Heatmap spiking deep into evenings and weekends. The Context-Switching Fatigue Index was at its highest recorded level for either employee.
  • The action takenThe engineering manager opened the Team Workload Distribution dashboard and saw the imbalance instantly: two team members at 96% capacity, three others at under 40%. She reassigned three integration subtasks to available engineers using TraqNext's Project Progress view to identify who had bandwidth. The rebalance took under an hour.
  • The outcomeThe two at-risk developers' hours normalised within four days. The release shipped on time. More importantly, the team now runs a weekly workload review using TraqNext's Timeline and Activity Summary reports — something that previously required three hours of manual spreadsheet consolidation per week.
image

Maximise Team Efficiency with Smarter Workload Distribution

TraqNext workload distribution tools enhance work allocation and elevate team performance — giving managers real-time visibility into workload capacity so they can identify instantly whether teams are overloaded, balanced, or available to take on more work. With company-wide workload insights available in real time managers can continuously track, adjust, and refine task allocation based on data rather than instinct — producing a more efficient, engaged, and high-performing team that drives sustainable growth without burning out.
Maximize team efficiency and balanced workload distribution in TraqNext

Staffing Optimisation: Identify Overstaffed & Understaffed Teams in Real Time

Staffing optimisation in TraqNext uses advanced drill-down insights to help managers determine in real time whether teams are overstaffed, understaffed, or carrying an uneven distribution of work. TraqNext data-driven workload guidance allows managers to reallocate resources efficiently and shift employees between teams with confidence — ensuring optimal workload distribution, scaling capacity based on real demand, and achieving significant cost savings through smarter staffing decisions. Easily shift employees between teams to maximise productivity and scale your workforce confidently.
Gain clear workload insights to optimize resource allocation in TraqNext

Remote Workload Visibility: Track Distributed Team Capacity in Real Time

Remote workload visibility in TraqNext gives managers full insight into distributed team capacity — identifying who is available, who is overloaded, and where tasks need to be redistributed to maintain a balanced and healthy workforce. A centralised dashboard displays real-time workload data for all remote employees — eliminating the need for constant check-ins and status meetings by replacing them with objective, always-current data. Track TraqNext tracks workload patterns across remote teams over time surfacing emerging trends , identifying chronic overload before it becomes burnout, and enabling proactive adjustments that keep distributed teams performing at their best.
Track remote team workload and task distribution in TraqNext

Frequently Asked Questions

Get started today

Keep your teams efficient while ensuring privacy and compliance, with help just a click away.
Explore today - full access, no credit card required!