Reports
Project Progress
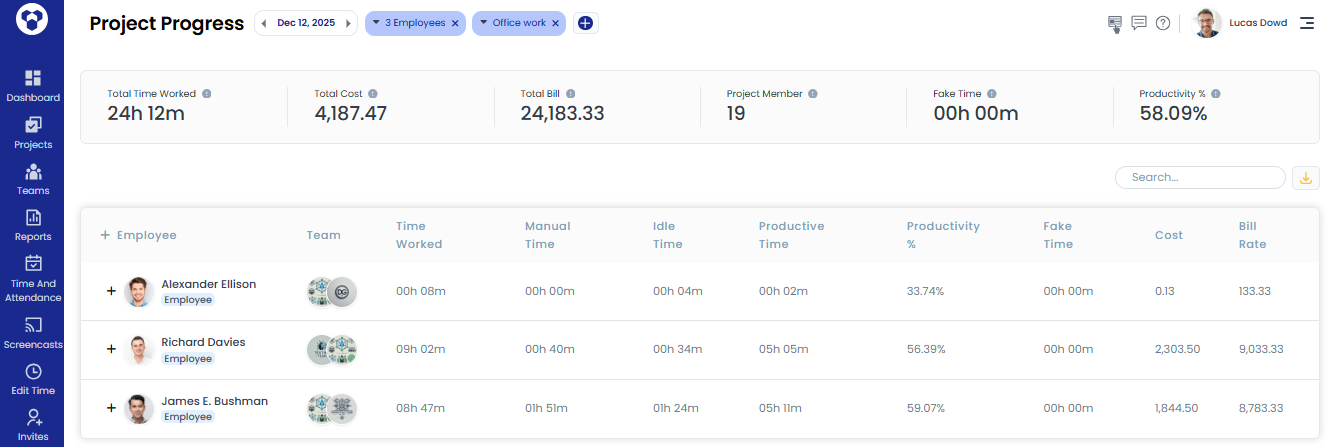
The report presents different statistics about the project worked on, like the total time worked, total cost, project members, overall productivity of selected project and employee(s)/ team(s). It also presents information about the project members, like time worked, manual time, idle time, productive time, productivity percentage and fake time (if fake time monitoring enabled by admin)
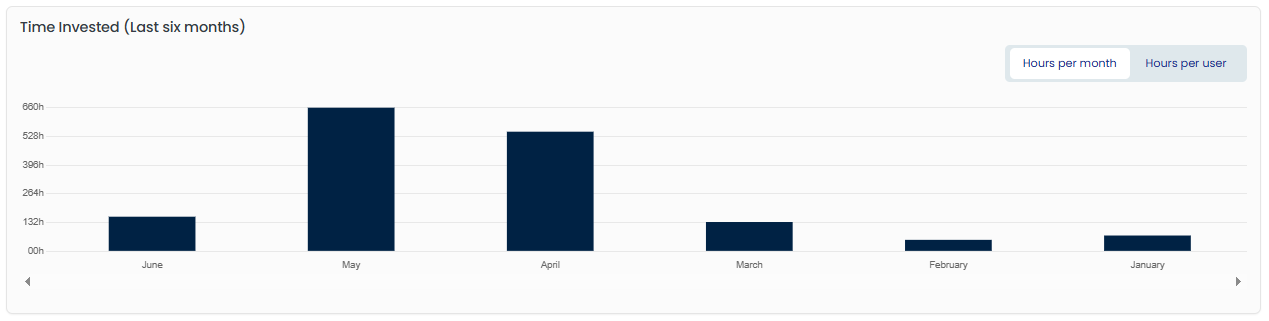
The chart Time invested presents the worked time of this project in two different ways, either you can see the time worked of each employee in project in last six months, or you can choose the Hours per month chart which depicts the total worked time of each month in last six months.
Step 1:
Go to the Project progress page under the main menu reports.
Step 2:
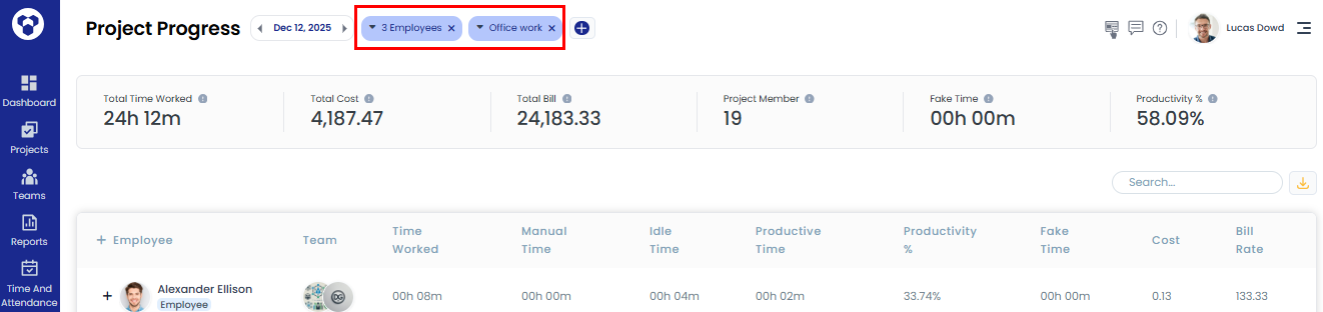
You must select a project and the employee(s)/team(s) from the filters to see the relevant statistics.
Step 3:
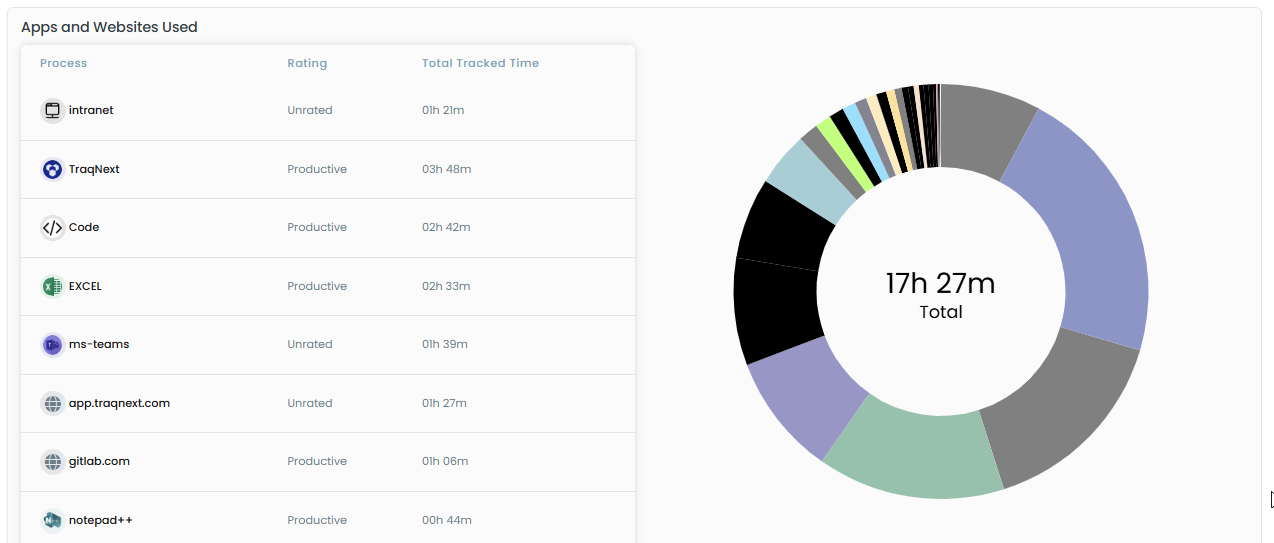
Under the section Apps and websites used, you can see all the websites and applications used by the employees or teams during work on the project.