Reports
Web and App Usage
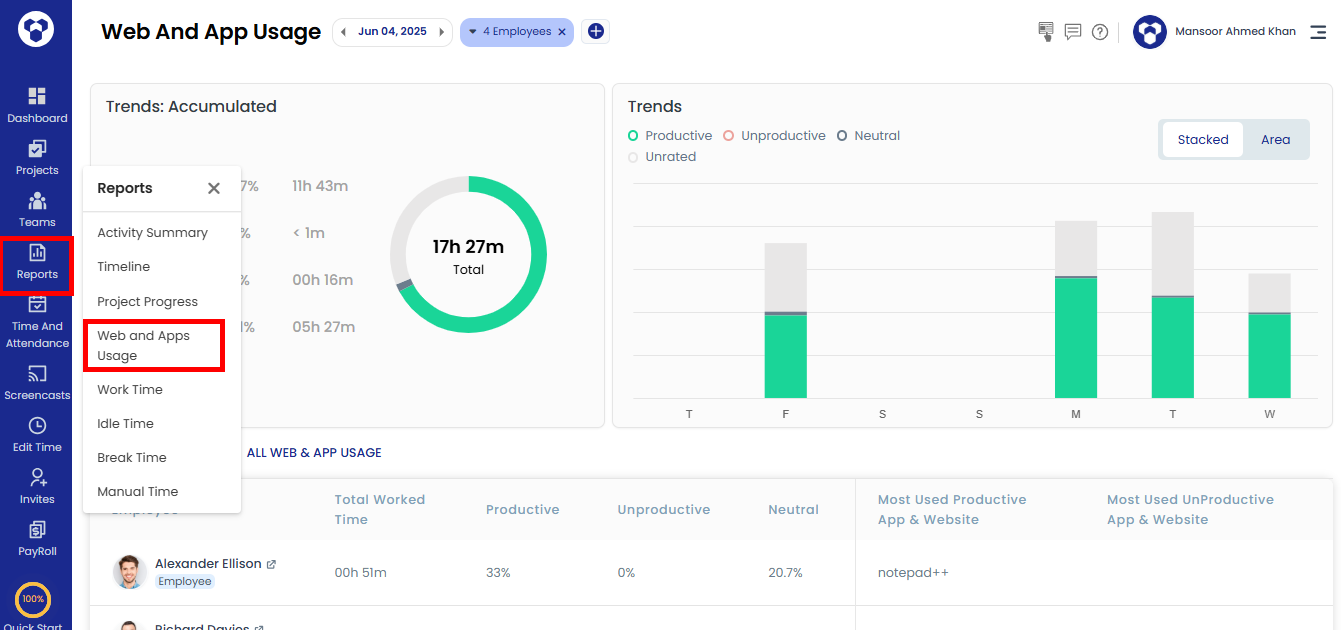
To monitor the usage of websites and applications in your organization, this report presents the usage details with different charts and drill down information.
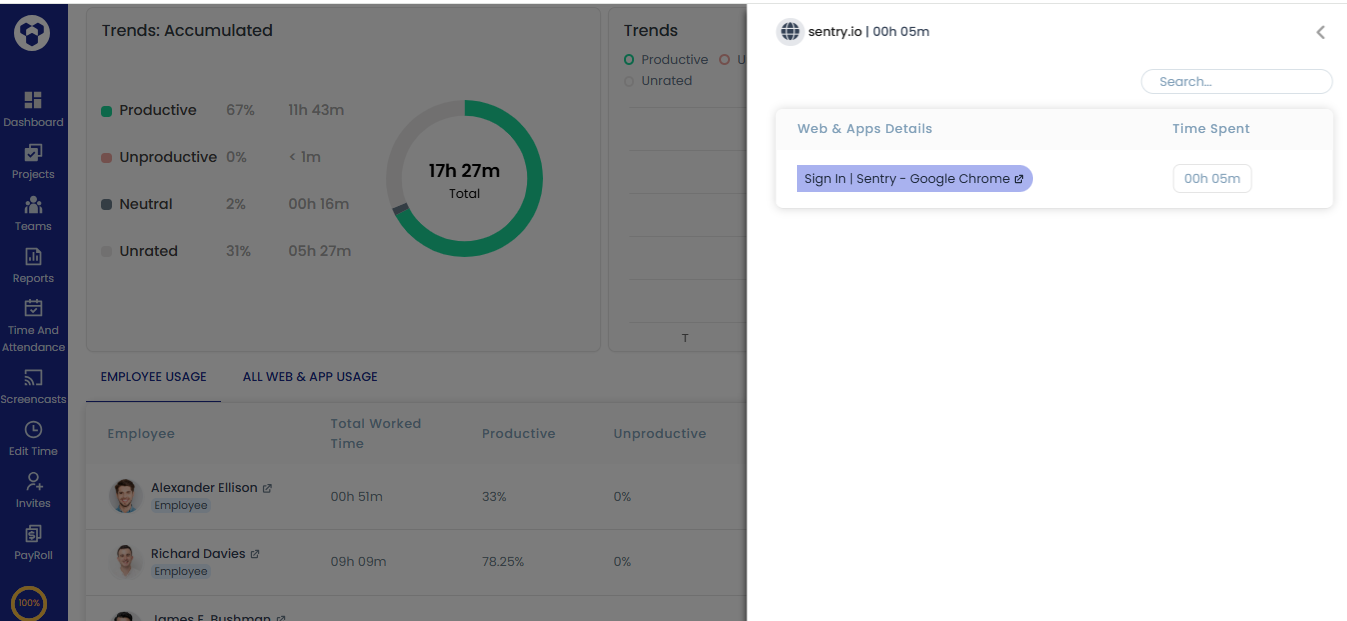
The chart Trends: Accumulated represents the overall usage percentage of productive, unproductive, neutral and unrated websites and applications in the organization. While the other trend chart depicts the usage of websites and applications per day.
NOTE: Please check the User Access Levels page to see which roles have access to this feature.
Step 1:
Go to the Web and App Usage page under the main menu Reports. Click on the All Web & App usage tab to see this report.
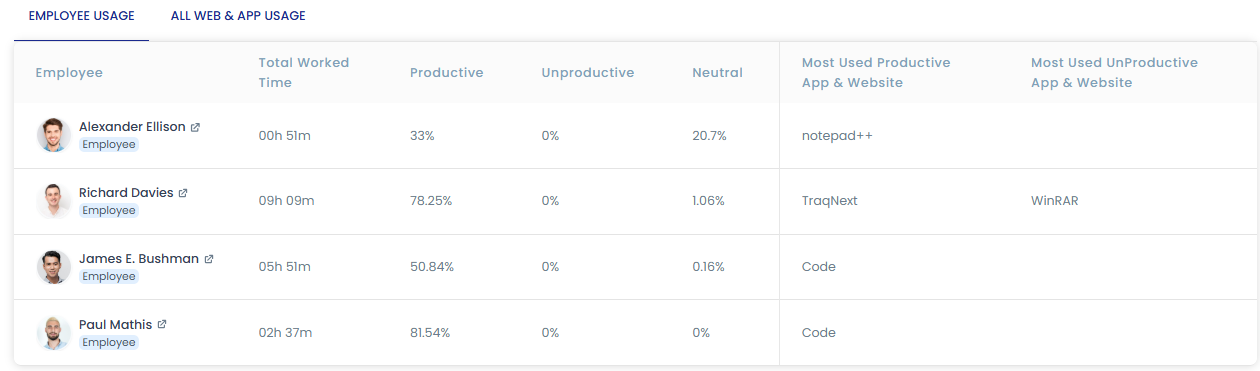
Step 2:
If you have selected an employee from the filters on the top. Under the Charts section, the tab Employee Usage will display the productivity statistics per employee, see the image below.
Step 3:
If you click on the employee’s name, a page will be opened which contains a list of all the websites and applications used by the employee, together with the time consumed on each one.
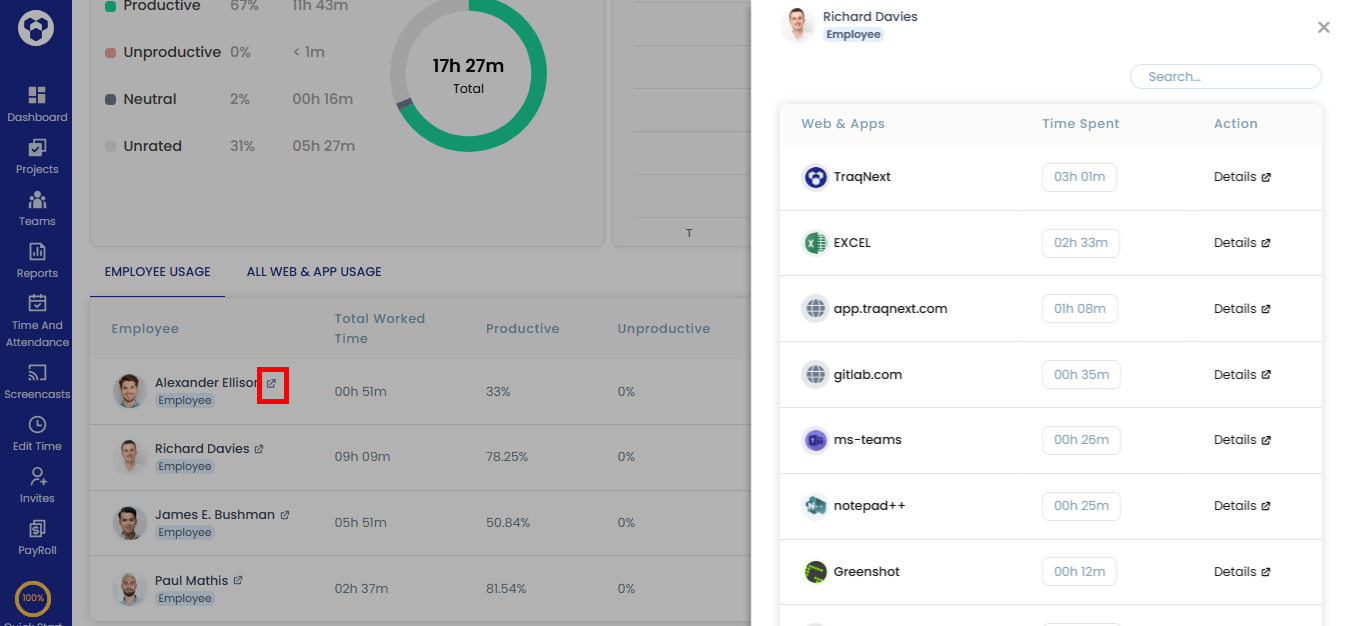
By clicking Details a further drill down-page will open with further details about the webpages visited for the selected website or different features of the application used.
Step 4:
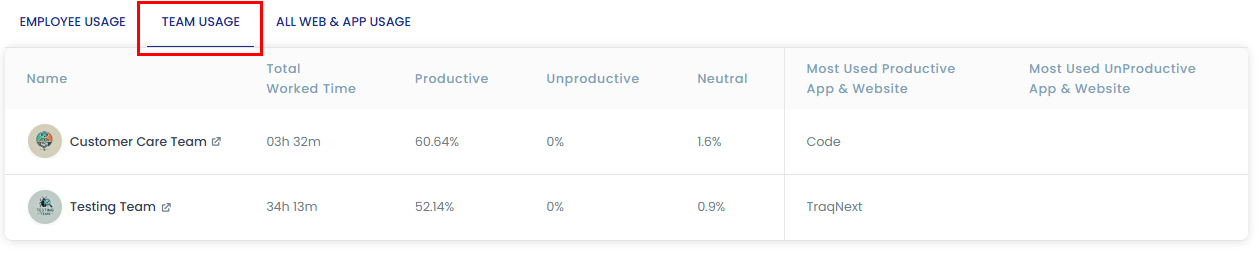
If you have selected team(s) from the page top filters, then the tab Team Usage will appear and display the productivity statistics per team, see the image below.
The detailed usage information of each website and application can be verified like mentioned in previous step 3.
The detail usage information of each website and application can be verified like mentioned in previous step 3.
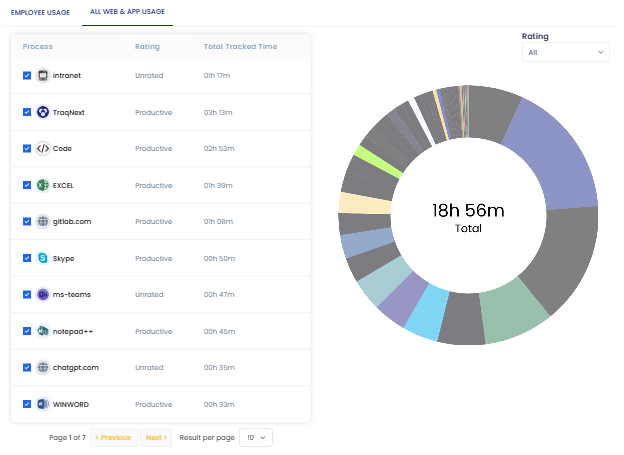
Step 5:
Under the tab All Web & App Usage, you can see all the websites and apps used by the employees or teams in the selected date range. To get a further glimpse of the usage, you can select different ratings (Productive, Unproductive, Neutral, Unrated) from the drop down. The usage data in the table and in the chart will be updated accordingly.