Tracking & Monitoring
Dashboard
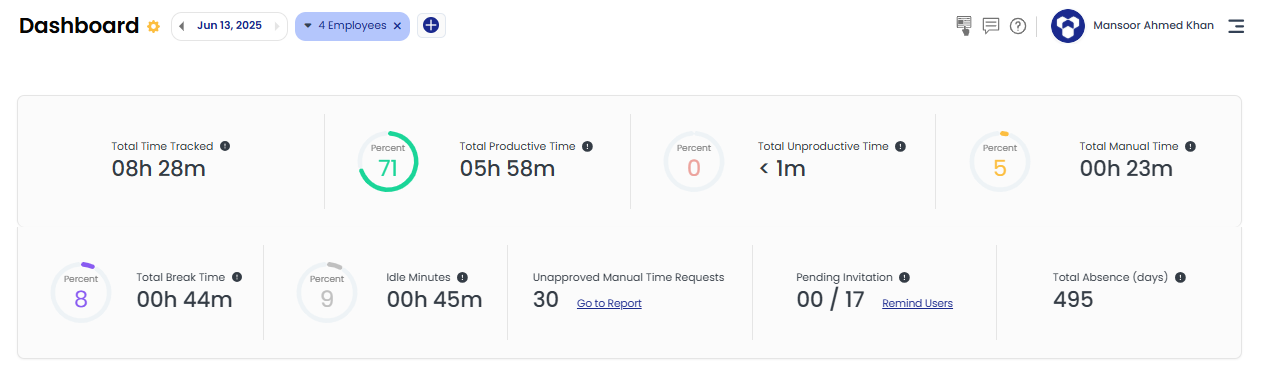
With the help of different charts and statistics, Dashboard presents the productivity overview of your whole organization for a selected date range.
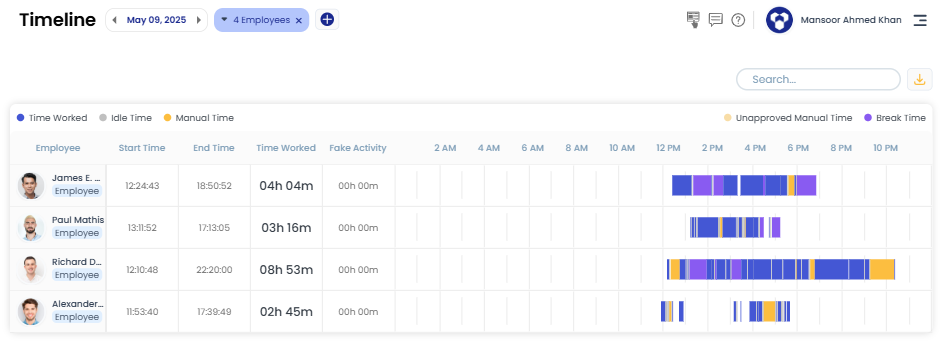
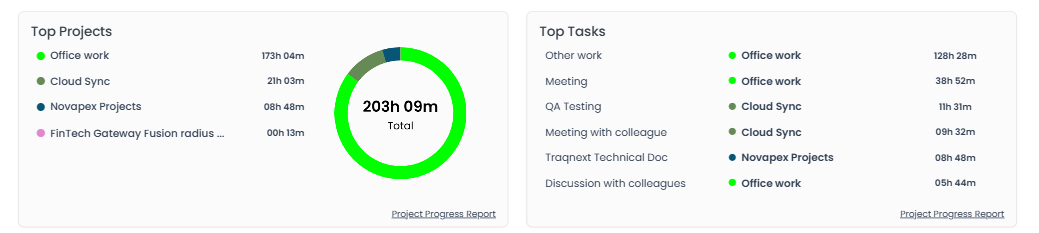
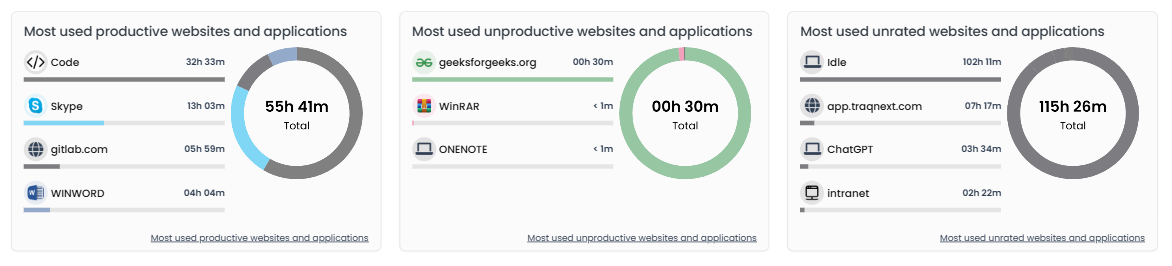
Different statistics include total time tracked, total manual time, total productive time, total unproductive time, idle minutes, and total break time. While the detailed information about organization productivity is presented using different charts, such as employee timeline, most worked projects and tasks, employee attendance, Web & App Productivity Percentages and the apps & websites usage time etc.